
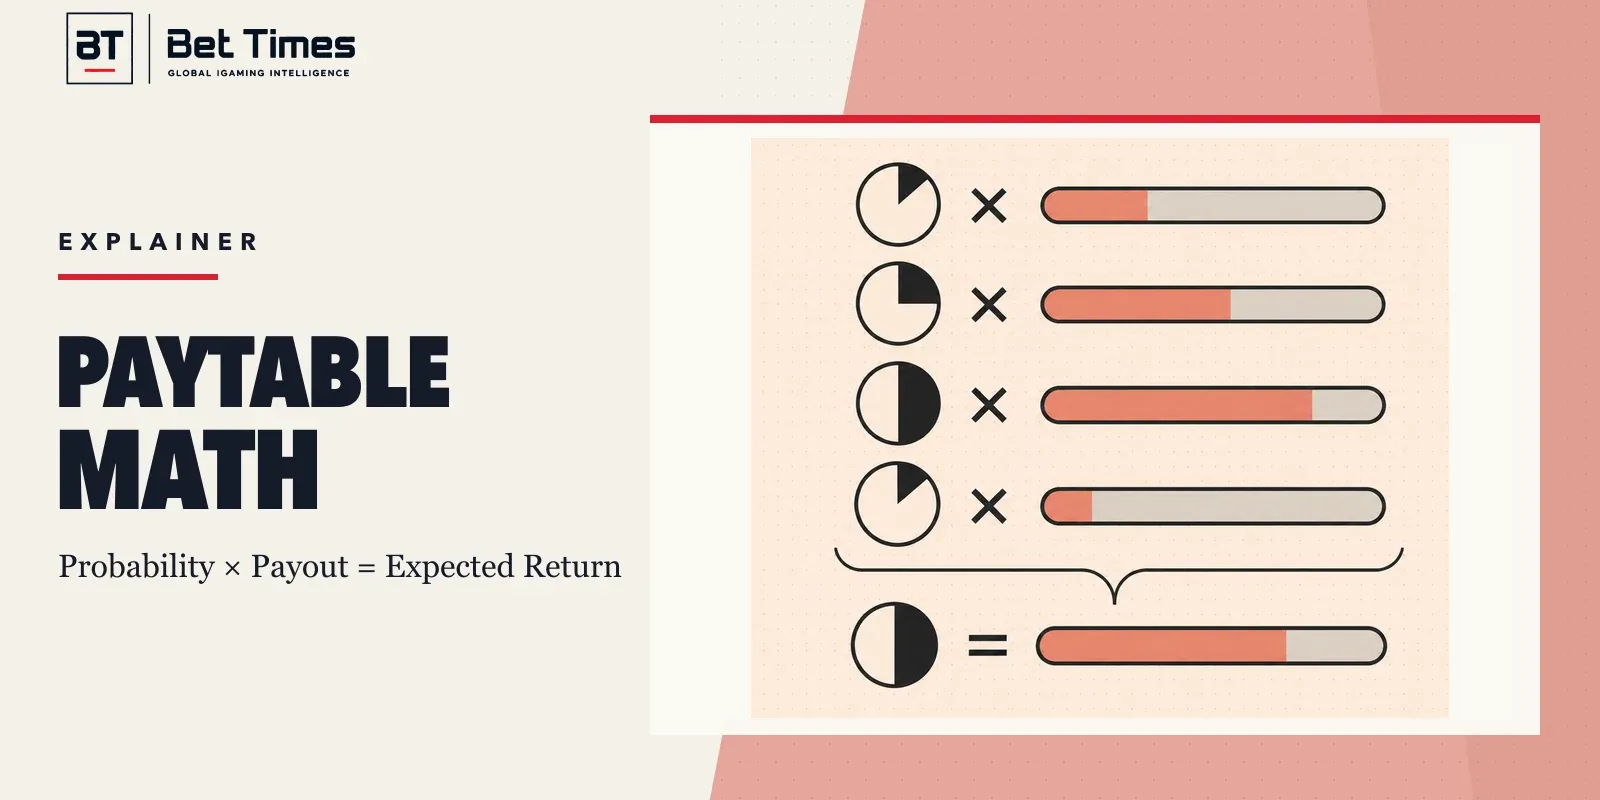
A casino paytable states what an eligible outcome pays under a particular set of game and stake rules. It does not automatically state how likely that outcome is. Theoretical RTP appears only when every possible return is weighted by its probability and the results are added together. A list of attractive prizes without the matching probabilities is therefore not a complete mathematical model.
This guide is for readers checking slot rules, product disclosures, test documents or game versions. It explains how payout multipliers work, what a PAR sheet adds, why a visible paytable is often insufficient to reproduce RTP and how base games, features and jackpots fit into one expected-return calculation.
What is a casino paytable?
A casino paytable is a rule set or schedule that associates eligible outcomes with prizes. In a slot, it may show how much three, four or five matching symbols return, how wilds substitute, what scatters award and which combinations trigger a feature. In a table game, it may show the settlement multiplier for a side bet or a special hand.
The important unit is the total stake basis. A value shown as “10x” might mean 10 times the total bet, 10 times a line bet or 10 times a denomination. Some interfaces describe a 10x return as a 9x profit plus the original stake; others use payout language differently. The game rules must settle that convention before any calculation begins.
The British Gambling Commission’s Remote Technical Standard 3 provides one regulatory example. It requires rules and payout information to be accessible before play and identifies paytables as one way to describe potential prizes. It separately requires information about RTP, house edge or probabilities where relevant. That separation is useful: a payout schedule and the likelihood of receiving each payout answer different questions.
Paytable, PAR sheet, probability data and RTP compared
The same game can be described by several connected records. Readers should identify which one they actually have before interpreting a number.
| Role | What it means | Where to verify |
|---|---|---|
| Player-facing paytable | Winning combinations, settlement rules, multipliers and feature instructions shown to the player. | Stake basis, direction, active lines or ways, wild/scatter rules, caps and version. |
| PAR sheet | Manufacturer specification for a particular mathematical configuration, potentially including RTP, hit frequency, symbols, reels, accepted credits and reel strips. | Exact build, variation, bet mode, feature scope and approval record. |
| Probability or reel data | The frequencies or weights that determine how often eligible outcomes can occur. | Independence assumptions, virtual weighting, mapping, reel order and feature states. |
| RTP figure | The expected or observed value returned relative to value wagered. | Theoretical versus actual, included components, sample basis, configuration and date. |
Gaming Laboratories International’s GLI-13 standard defines a PAR sheet as a game specification that can include theoretical RTP, hit frequency, symbol combinations, reel count, accepted credits and reel-strip listings. It describes a paytable or variation more broadly as the game’s mathematical behaviour based on PAR-sheet data, inclusive of the return percentage and possible awards.
Consumer interfaces often use “paytable” more narrowly for the visible payout screen. Technical records may use the term for a complete mathematical variation. Neither usage is necessarily wrong, but the distinction must be made explicit. When BETTIMES refers to the visible paytable below, it means the player-facing schedule rather than the full confidential mathematics package.
How paytable mathematics becomes RTP
Every possible return contributes to theoretical RTP in proportion to its probability. For a one-unit stake, the compact formula is:
Expected return per unit = sum of (outcome probability × total return multiplier).
If stakes vary, the same logic can be expressed in money or credits: multiply each possible payout by its probability, add those expected payouts, then divide by the total amount wagered. The calculation must cover the complete game cycle under the specified rules. Leaving out a losing outcome, a feature contribution or a jackpot deduction changes the result.
The formula also explains why RTP and slot hit frequency are different. Hit frequency asks how often a defined award event occurs. RTP asks how much value all outcomes contribute after both frequency and size are considered. A rare 30x return can contribute more expected value than a frequent 1x return.
A worked 96% teaching model
Consider a deliberately simple game with a one-unit stake and four mutually exclusive results. “Return” here includes any returned stake. The model is not taken from a commercial casino game; it exists only to show the arithmetic.
- A 0x return occurs with 70% probability: 0.70 × 0 = 0.00 expected units.
- A 1x return occurs with 20% probability: 0.20 × 1 = 0.20 expected units.
- A 2x return occurs with 8% probability: 0.08 × 2 = 0.16 expected units.
- A 30x return occurs with 2% probability: 0.02 × 30 = 0.60 expected units.
The contributions total 0.96 expected units for each unit staked. The theoretical RTP is therefore 96%. The complementary theoretical house edge in this simplified fully defined model is 4%, before considering any rule or accounting convention not included in the example.
The same model has a 30% any-return hit frequency because the three non-zero outcomes occur with combined probability of 20% + 8% + 2%. Its net-positive frequency is only 10%, because the 1x outcome returns the stake without producing a profit. This one example demonstrates why paytable, hit frequency and RTP should never be treated as synonyms.
Why the visible paytable usually cannot reproduce RTP
A visible slot paytable may tell you that five premium symbols return 500x, but it may not reveal how often each symbol can land in the required positions. Without those probabilities, the expected-value term for that prize is unknown. Large multipliers alone say nothing reliable about their contribution to the overall return.
Physical reel strips make the missing input intuitive. If one symbol appears once on a 20-stop reel and another appears five times, their landing probabilities differ even if both are drawn at the same size. Digital games can use virtual mapping and weighted outcome tables, so the visible reel window does not necessarily expose the underlying frequency structure.
The RNG supplies random input; scaling and mapping logic converts that input into game outcomes. GLI-11 defines a scaling algorithm as the method that maps a larger RNG range into a smaller range for use in the game. The artwork shows the result, not the complete mapping table. Counting visible symbols or recording a short session cannot reconstruct that hidden model with certification-level confidence.
Reel combinations are not always simple multiplication
For a basic independent three-reel model, the probability of a particular ordered combination can be found by multiplying the relevant per-reel probabilities. If symbol A has probability 1/10 on each independent reel, the probability of A-A-A is 1/10 × 1/10 × 1/10, or 1/1,000.
Real games add conditions. Symbols may have different frequencies on each reel. Wilds may substitute for several symbols. Scatters may pay anywhere, line wins may be evaluated left to right, and ways-to-win rules may count adjacent matching positions rather than fixed lines. The model must also say whether coinciding awards are added, capped or replaced by the highest prize.
These rules create dependencies and overlaps. Adding the raw probability of every displayed line win can double-count reel outcomes that generate several awards at once. The reliable method enumerates or simulates complete outcomes under the exact settlement rules, then assigns the total return for each outcome once.
How bonus features contribute to the paytable
A feature is part of RTP when it is funded by the wager and its awards form part of the approved game cycle. Its expected contribution depends on at least two layers: the probability of triggering the feature and the conditional distribution of returns after it starts. If a feature triggers on 1% of base rounds and returns an average of 20 stake units when triggered, its simplified expected contribution is 0.01 × 20, or 0.20 units per qualifying base round.
That shortcut works only when “20 units” is a correctly calculated conditional average and the cycle boundaries are clear. Retriggers, persistent states, player choices, extra wagers and multiple feature paths can require a more detailed state model. A buy-feature option may also have its own stake basis and approved mathematics rather than being a simple shortcut into the ordinary base-game calculation.
GLI-19’s interactive gaming standard treats intermediate bonus or feature phases as recordable parts of game play and calls for rules governing feature status and operation. It also requires operators under its control framework to maintain current documentation, such as PAR sheets, for theoretical RTP, credits, payout schedules and other game information.
How progressive jackpots affect expected return
A progressive jackpot can receive a stated contribution from qualifying wagers. The total theoretical return may therefore contain a base-game component and a jackpot component. The jackpot’s current displayed value can change over time, while its trigger probability and contribution rules belong to the game or network specification.
Do not assume that a changing headline jackpot makes every other paytable value variable. The base schedule may remain fixed while one award accumulates. Conversely, a local, pooled or mystery jackpot may use rules that are not visible in the symbol table. The source must say whether the published RTP includes the progressive contribution and at what assumptions or jackpot state.
GLI-19 identifies changes to progressive increments as changes that affect a game’s theoretical RTP and says those changes should be treated as a new record for reporting purposes under its control framework. This is another reason to bind an RTP claim to a specific configuration and date rather than only to a marketing title.
Why the same game title can have several RTP versions
A supplier can make more than one approved mathematical configuration available under the same visual title. The artwork, symbols and headline prizes may look identical while reel strips, outcome weights or feature contributions differ. A casino can then select from the configurations allowed for its market and platform.
The practical implication is simple: never copy an RTP from a review, another casino or an old help file and assume it applies to the game currently open. Check the information panel for that deployment. A version identifier, test record, game theme/paytable ID or dated rules page provides stronger evidence than the title alone.
GLI-19 requires a system covered by the standard to maintain a unique game theme/paytable ID and the theoretical RTP for each available paytable. Its reporting model separates theoretical and actual RTP and records changes affecting theoretical return. Those controls show why versioning is part of the mathematics, not administrative trivia.
Theoretical RTP versus observed RTP
Theoretical RTP is derived from the approved probability and payout model or from sufficiently controlled simulation of that model. Observed, actual or live RTP is the ratio produced by recorded wagers and recorded returns over a stated sample. GLI-11 distinguishes theoretical RTP, based on calculations or simulations, from actual RTP based on meters from a fielded device.
An observed sample can sit above or below the theoretical value because random outcomes vary. The paytable does not promise that a 96% theoretical game will return 96 units in every 100-unit session. The number describes a long-run expectation under the stated model, not a session target or a debt that the next spins must repay.
This also means that an apparent match in a tiny sample proves little. Verification uses the mathematics, implementation evidence and a testing plan designed for the game’s distribution. The British Gambling Commission’s testing procedure describes maths verification, source-code analysis, game play and review of scaling or mapping. It expects player-facing rules to accord with the underlying mathematics.
A casino paytable verification checklist
Use these eight checks before quoting a payout or calculating expected return:
- Identify the stake basis. Confirm whether every multiplier applies to total bet, line bet, denomination or another unit.
- Copy the complete settlement rule. Record win direction, minimum matches, wild and scatter behaviour, coinciding-win rules and any cap.
- Find the probability input. Look for reel strips, outcome weights, card or dice probabilities, or a complete mathematical specification.
- Define the game cycle. State whether features, retriggers, jackpots, extra wagers and persistent states are included.
- Match the version. Record the game build, variation, RTP configuration, jurisdiction and date.
- Separate theoretical and observed figures. Do not substitute a session sample for approved mathematics.
- Reconcile all outcomes. Probabilities for mutually exclusive complete outcomes should sum to 100%, and every payout contribution should be counted once.
- Preserve the evidence. Save the rules page, source URL, test reference and verification date so the calculation can be repeated.
If any probability input is missing, stop before claiming a reconstructed RTP. You can still describe the advertised payouts and published RTP separately, but you cannot prove how the first produces the second.
Common mistakes in casino paytable mathematics
- Treating the largest multiplier as evidence of a high RTP.
- Assuming equally sized symbols are equally likely to land.
- Reading a multiplier without checking whether it includes the returned stake.
- Adding line-win probabilities that overlap on the same reel outcome.
- Ignoring features, jackpots, retriggers or extra-wager rules.
- Using the headline number of paylines or ways as an outcome probability.
- Mixing a paytable from one RTP configuration with reel data from another.
- Presenting observed session return as the game’s theoretical RTP.
- Believing a long losing sequence changes what the paytable says about the next independent result.
Frequently asked questions
Can you calculate RTP from a casino paytable?
Only if the paytable is accompanied by the complete probability of every possible total return and the stake and settlement rules are unambiguous. A visible list of winning multipliers is usually insufficient because it does not disclose symbol weights, reel strips, mapping, feature probabilities or overlapping-win treatment.
Is a paytable the same as a PAR sheet?
Not always. Player-facing usage normally calls the visible payout schedule a paytable. A PAR sheet is a technical specification that may include RTP, hit frequency, symbols, reels, accepted credits and reel strips. Some technical standards use “paytable” or “variation” for the broader mathematical configuration, so context matters.
Does a bigger maximum payout mean better RTP?
No. RTP depends on both payout size and probability. A 50,000x maximum can make a very small expected-value contribution if its probability is extremely low, while frequent small returns can contribute much more. Maximum win, hit frequency, volatility and RTP describe different properties of the same game model.
Why can one slot have different RTP percentages?
The supplier may offer several approved mathematical configurations under the same title. They can share artwork and headline prizes while using different reel strips, outcome weights or feature contributions. Check the RTP and version information inside the deployed game rather than relying on a figure copied from another operator or review.
Does a 96% RTP mean I get 96% of each bet back?
No. A 96% theoretical RTP is an expected aggregate ratio across the complete probability model and a very large number of game cycles. Individual rounds and sessions can return far more or far less. It does not predict the next outcome or guarantee recovery after losses.
The reliable way to read a paytable
A casino paytable is the payout half of an expected-value calculation. To turn it into theoretical RTP, you also need the probability of every complete outcome, the exact stake basis, all feature and jackpot contributions, the settlement rules and the correct game version. Without those inputs, the responsible conclusion is not an estimate; it is that the calculation cannot be reproduced from public information alone.
Use the table to understand what qualifies and what it pays. Use the approved mathematics or a traceable test record to understand how often those outcomes occur. Then keep the theoretical figure separate from any short observed sample. For limits and support information, see the BETTIMES responsible gambling guide.