
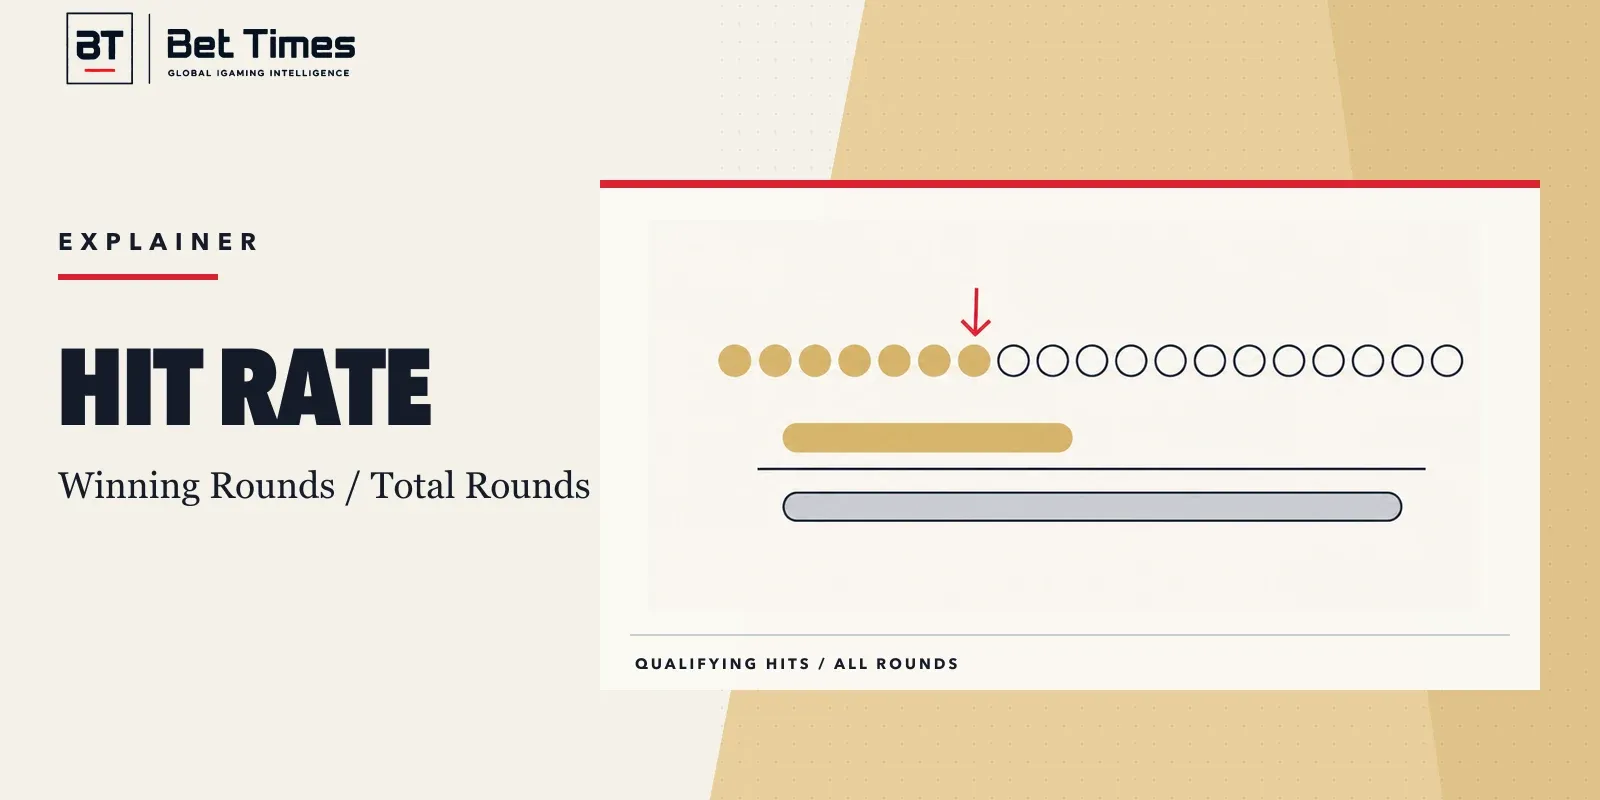
Slot hit frequency is the share of evaluated rounds that produce an outcome classified as a hit or prize under a stated set of rules. If 25 of 100 rounds meet that definition, the observed hit frequency is 25%. The crucial qualifier is classified: a small return can count as a hit even when it is less than the total stake.
This guide is for readers comparing game mathematics, product disclosures or test documents. It explains the percentage convention used by BETTIMES, why some sources use “rounds per win” instead, and how hit frequency differs from RTP, volatility and the chance of finishing a session ahead.
What is slot hit frequency?
In the percentage convention, slot hit frequency is the proportion of completed game rounds that satisfy the game’s defined hit condition. A “hit” commonly means that the round produces at least one award or prize event. That condition must be read from the game mathematics, PAR sheet, rules or measurement specification rather than assumed from the label alone.
Gaming Laboratories International defines a PAR sheet as a game specification that can include theoretical RTP, hit frequency, symbol combinations, reels, accepted credits and reel strips. Its definition matters because it places hit frequency beside — but not inside — RTP and the rest of the mathematical design. They are separate fields describing the same game configuration.
The term is not expressed identically in every document. Some suppliers and analysts publish a percentage. Some research datasets use a quotient such as average wagers divided by recorded wins, which reads as “one win every X rounds.” Both can describe occurrence frequency, but the direction of the number changes. A higher percentage means more frequent hits; a lower rounds-per-win figure also means more frequent hits.
How is slot hit rate calculated?
For a percentage-based report, the calculation is:
Hit frequency = qualifying hit rounds ÷ total evaluated rounds × 100.
Suppose an audit sample contains 10,000 completed rounds and 2,400 meet the stated hit definition. The observed hit frequency is 2,400 ÷ 10,000 × 100, or 24%. This is a sample statistic for those rounds, not proof that exactly 24 of the next 100 rounds will produce hits.
For a rounds-per-hit expression, invert the relationship. The same sample contains one observed hit for every 10,000 ÷ 2,400, or about 4.17 rounds. A document reporting “4.17” without its unit can therefore be misread as 4.17% even though it means approximately one hit in 4.17 rounds.
Always record five pieces of context beside the figure:
- Whether the number is a percentage or rounds per hit.
- The exact outcome counted as a hit.
- Whether it is theoretical or observed.
- The game version, RTP configuration and bet mode.
- Whether base-game rounds, features, jackpots or all game cycles are included.
What counts as a hit?
There is no safe answer without the definition used by the game or report. A base-game line prize may count. A scatter award, feature trigger, jackpot event or combined multi-line return may also count. A feature containing several internal awards might be treated as one initiating game cycle in one analysis and as several events in another.
The British Gambling Commission’s Remote Technical Standard 3 requires game rules to describe what constitutes a winning outcome and makes the way winners and prizes are determined available before a customer commits to gamble. That standard does not turn “hit frequency” into one universal consumer metric. It does establish why the underlying win definition, rules and likelihood information matter.
The safest comparison begins with the total game cycle. Ask whether a hit means any non-zero award, any round with celebratory feedback, a return equal to the stake, or only a return greater than the stake. Those are materially different conditions.
Hit frequency, RTP and volatility compared
These metrics answer different questions. None is a substitute for the others, and none describes the full experience on its own.
| Role | What it means | Where to verify |
|---|---|---|
| Hit frequency | How often a defined round or event qualifies as a hit. | The size of each return, long-run value or next result. |
| RTP | The theoretical or observed value returned relative to value staked. | How often returns occur or how widely outcomes are spread. |
| Volatility | The dispersion and concentration of outcomes around the expected return. | The exact next outcome or a universal low-to-high category. |
| Maximum win | The largest award permitted by the stated rules and bet configuration. | How likely that award is or how much RTP it contributes. |
Return to player combines prize values and their probabilities into an expected long-run ratio. Hit frequency ignores award size once an outcome passes the hit definition. Two models can therefore have the same RTP and different hit rates, or the same hit rate and different RTP.
Casino volatility adds information about distribution. A game can produce frequent small awards and rare large awards, or concentrate more return in fewer events. A hit-rate number alone does not reveal which pattern applies.
How two models can share an RTP but have different hit rates
Consider two simplified teaching models with 100 rounds at a stake of 1 unit per round. Both return 96 units in total, producing a 96% sample return. Model A distributes those 96 units across 40 qualifying rounds. Model B distributes them across 10 qualifying rounds.
Model A has a 40% observed hit frequency. Model B has a 10% observed hit frequency. Their sample return is identical, but the occurrence pattern is not. The example demonstrates a mathematical distinction; it is not data from a commercial game and says nothing about the precise volatility of either model without the full list of outcomes.
The reverse also works. Two models can each register hits on 25% of rounds while returning different total values because the sizes of those 25 awards differ. This is why “high hit rate” is not a synonym for “high RTP” or “better value.”
Can a hit still be a net loss?
Yes, if the measurement counts any prize-bearing result rather than only returns above the total stake. A round staked at 1 unit that returns 0.40 units contains an award but leaves a net loss of 0.60 units. Depending on the specification, it may still enter the hit-frequency numerator.
Gambling research calls celebratory sub-stake returns “losses disguised as wins” when lights or sounds make them resemble genuine net wins. In a 2023 online experiment involving 940 participants, researchers found that participants shown these outcomes overestimated genuine wins compared with a control condition. The study separated returns greater than the stake from events that looked or sounded like wins while remaining net losses.
British rules now address that presentation issue directly. Remote Technical Standard 14F says an online slot must not celebrate a return that is less than or equal to the total stake gambled. This is a display and product-design requirement; it does not prevent a technical report from counting a sub-stake award under a broader mathematical hit definition. Readers still need to check what the reported rate includes.
Does playing more paylines change hit frequency?
It can change how often at least one active wager produces an award, but the effect depends on the game. In a selectable-line model, activating additional slot paylines may create more simultaneous routes on which a prize can occur. It may also increase the total stake when each line is priced separately.
The individual line events may share reel positions and therefore are not automatically independent. Scatters, wilds, bonus triggers and coinciding wins can further change the calculation. Multiplying a single-line hit rate by the number of lines is usually not a valid way to derive the whole-spin rate.
A ways-to-win game presents the same caution. The headline number of ways counts eligible position paths under stated layout rules. It does not disclose symbol probabilities, prize values or feature weights, so it cannot produce a hit rate without the rest of the mathematical model.
Theoretical hit frequency versus observed hit frequency
A theoretical hit frequency comes from the complete approved game model. If every possible state and its probability are known, the qualifying probabilities can be added directly. For a very large or feature-rich state space, a controlled simulation may estimate the theoretical behaviour under documented assumptions.
An observed hit frequency is calculated from actual or simulated rounds. It moves around the theoretical value because finite random samples vary. Small samples usually show more visible variation than large samples, but no fixed sample size guarantees an exact match. The required precision depends on the expected rate, desired confidence, game structure and testing purpose.
This distinction mirrors the theoretical-versus-actual distinction in RTP. GLI defines RTP as the ratio of total amount won to total amount wagered and says it may be theoretical, based on mathematics or simulation, or actual, based on metering from a fielded device. A hit-rate figure should be labelled with the same discipline.
Why a hit rate cannot predict the next spin
Hit frequency is a property of a model or a summary of a sample. It is not a countdown. If a properly implemented game uses independent random selections, a long gap since the last hit does not make a hit “due,” and a recent run of hits does not exhaust a quota.
The random number generator supplies random input, while game logic maps that input to symbols, features and awards. The remote gaming server can execute and record the game cycle. Neither component looks at a public hit-frequency percentage and schedules outcomes to force a short sequence toward it.
An observed session can sit above or below the long-run rate. Extending play to “let the average catch up” increases exposure; it does not create a reliable recovery mechanism. The safer use of the number is descriptive comparison, not session prediction.
How testing verifies the number
Independent testing begins with a defined build and configuration. The laboratory can inspect source code, reel strips or probability tables, paytable logic, feature behaviour, scaling and mapping, and the method used to calculate theoretical results. It can then compare the implementation with the supplied mathematics.
The Gambling Commission’s testing procedure expects approved test houses to review player-facing game content against the mathematics and verify that outcomes can be checked under the rules. GLI’s standards likewise treat the PAR sheet and paytable as configuration-specific mathematical records. A certification conclusion therefore belongs to the tested version, not automatically to every game with the same marketing title.
BETTIMES’ game-testing guide explains the wider assurance chain. For hit frequency, the useful evidence is not merely a screenshot of a percentage. It is a reproducible definition, calculation basis, version reference and traceable test record.
A practical hit-frequency verification checklist
Use this checklist before quoting or comparing a rate:
- Copy the exact label, value and unit from the source.
- Record whether the rate is theoretical, simulated or observed.
- Identify the numerator: any award, net-positive round, feature trigger or another event.
- Identify the denominator: spins, game cycles, wagers, lines or feature events.
- Match the exact game, version, RTP setting, stake mode and enabled features.
- Check whether equal-to-stake and below-stake returns count.
- Do not infer RTP, volatility or maximum-win probability from the rate.
- Preserve the source date and jurisdiction because display and testing rules can change.
If any of these fields is missing, describe the figure narrowly. “The supplier reports a 25% hit rate for this configuration” is more accurate than turning it into a universal statement about all versions or all types of wins.
Common mistakes when reading hit rate
- Treating hit frequency as the chance of finishing a session ahead.
- Assuming every recorded hit returns more than the total stake.
- Reading rounds per win as if it were a percentage.
- Comparing a base-game rate with an all-features rate.
- Comparing different RTP versions or bet modes under one title.
- Multiplying a single-line rate by the number of paylines.
- Using a short observed sample as the certified theoretical value.
- Believing a sequence of losses makes the next hit more likely.
Frequently asked questions
What is a good hit frequency for slots?
There is no universal “good” threshold. A higher rate means the stated hit condition occurs more often, but it does not show award size, RTP, volatility or the rate of net-positive rounds. Compare only figures with the same definition, unit, game version and feature scope, then read the complete paytable and rules.
Is hit frequency the same as win rate?
The terms are sometimes used interchangeably, but they can describe different numerators. “Hit” may include any prize-bearing outcome, while “win rate” may mean only returns greater than the stake. Check the source definition. If none is supplied, do not assume that the two rates measure the same event.
Does a higher hit frequency mean higher RTP?
No. Hit frequency counts how often qualifying events occur; RTP weighs how much value all outcomes return relative to stakes. A game can produce many small awards and a lower RTP, or fewer larger awards and a higher RTP. The complete probability and prize distribution determines both figures.
Can hit frequency tell me when a slot will pay?
No. A theoretical rate describes a long-run probability model, and an observed rate summarises completed rounds. Neither schedules the next random selection. A game can produce long or short gaps by chance, so previous results should not be used as a countdown or a reason to continue gambling.
Where can I find a slot game’s hit rate?
Check the game help file, supplier documentation, PAR sheet or a test report for the exact version. Many consumer interfaces publish RTP but not hit frequency. If no rate is disclosed, it cannot be reconstructed from the reel display or a short session without the underlying probabilities and a defined measurement method.
The reliable way to use hit frequency
Slot hit frequency answers one narrow question: how often does a precisely defined event occur within a stated game model or sample? Use the percentage only after confirming the hit definition, denominator, version, feature scope and whether the result is theoretical or observed.
Then read it beside RTP, volatility and the paytable. Do not use it to predict the next result or to justify extending play. For limits and support information, see the BETTIMES responsible gambling guide.